
Electric field mapping for cost-effective gel electrophoresis applications
Keywords:
equipotential lines, vector field, electric potential, saltwater conductivityAbstract
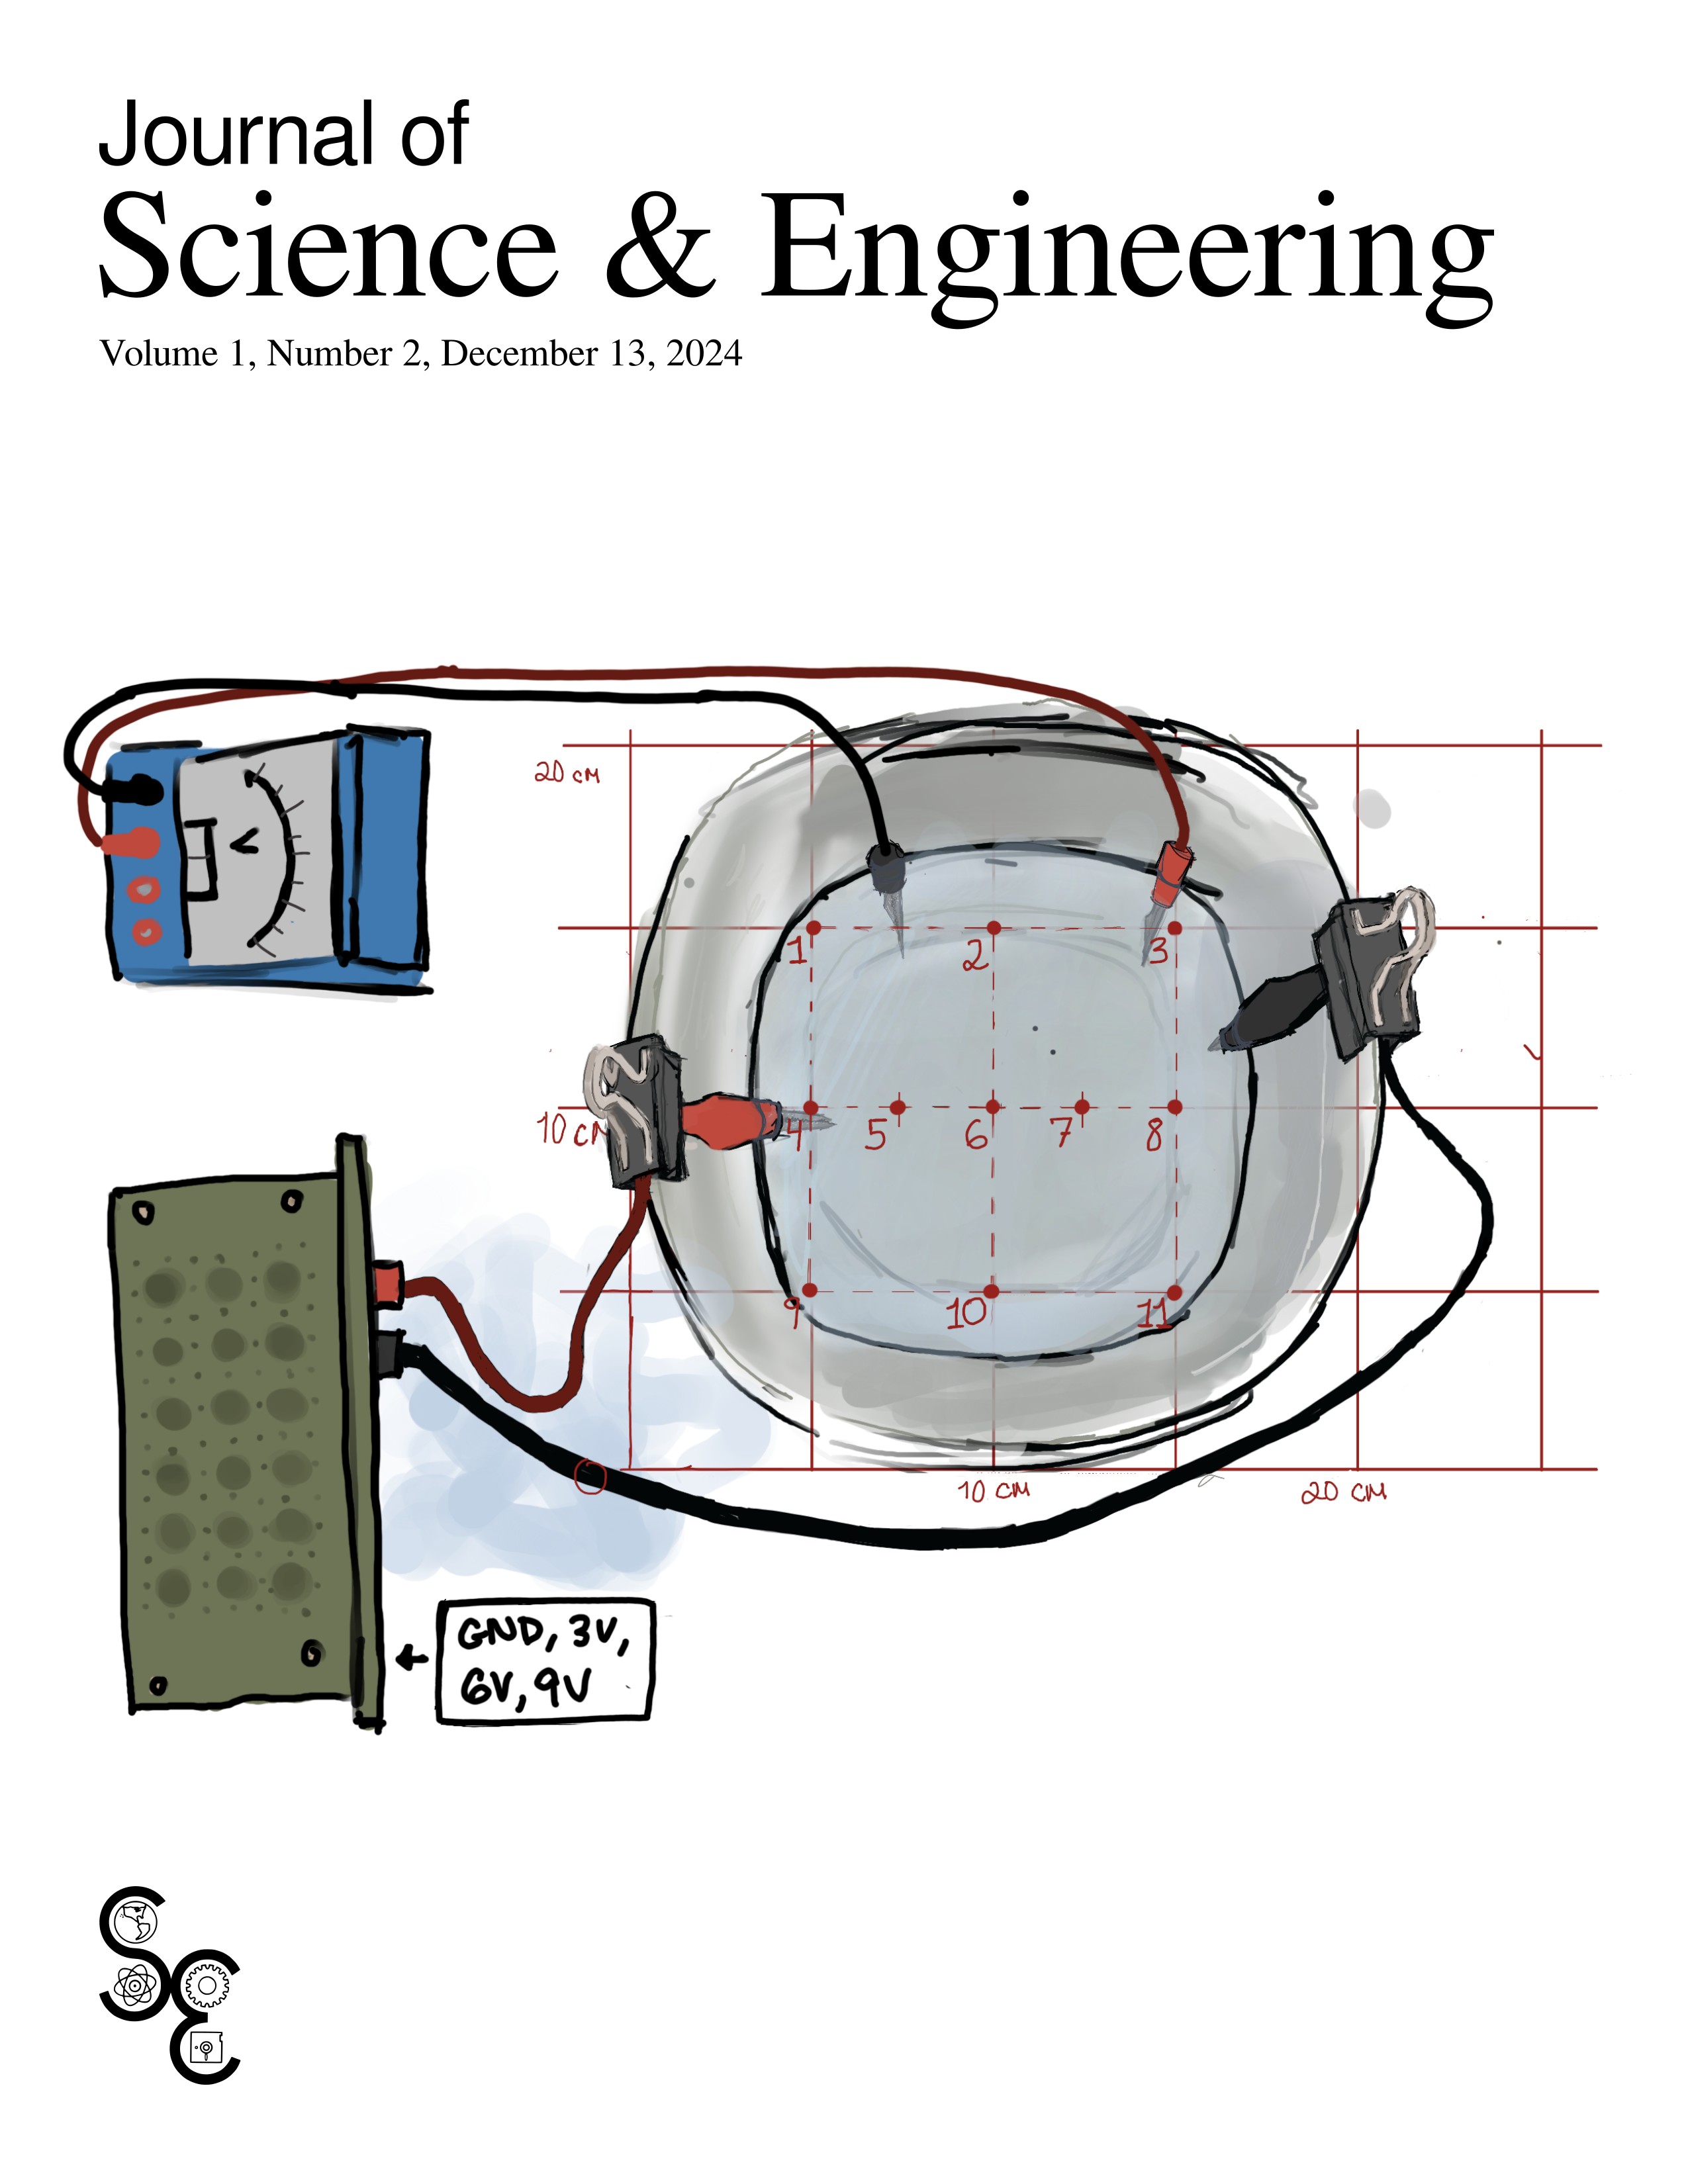
In this experiment, we tested the functionality of a low-cost electrophoresis rig by utilizing two electrodes, a battery, and a voltmeter, to map the electric field and equipotential lines formed by a positive and negative charge placed in the rig. After placing a positive charge on the origin and a negative charge on the positive y-axis of the coordinate system in the electrophoresis rig (saltwater tub), we took voltage measurements across various chosen points in the container. Using these measurements, we drew the equipotential lines by identifying regions of equal voltage and then calculated/drew electric field lines. We hypothesized that equipotential lines would have a higher concentration closer to the origin, the voltage would be high near the positive charge and decrease as we move away and toward the ground, and the electric field would point away from the positive charge and toward the ground. Ultimately, our results aligned with our hypotheses, demonstrating the viability of this rig as an educational tool for biology students to use in an electrophoresis lab.
References
P. A. Tipler and G. Mosca, Physics for Scientists and Engineers, 5th ed. New York: W H Freeman and Company, 2004.
A. Cantt, B. Kumar, and I. Singh, “Equipotential surface plotting,” https://depthome.brooklyn.cuny.edu/physics/lab/phy2/newlabs/Equipotential-Surface-ver-2-with-graphs.pdf, 2013.
C. Fongsuwan, P. Teangsriwan, C. Traiwan, and S. Buaprathoom, “A system displaying equipotential lines from electrodes in real time,” Journal of Physics: Conference Series, vol. 1380, p. 012163, 2019.
L. Urry, M. L. Cain, S. A. Wasserman, P. V. Minorsky, and R. B. Orr, Campbell Biology, 12th ed. Pearson, 2021.
J. Stewart, D. Clegg, and S. Watson, Multivariable Calculus, 9th ed. Cengage, 2020.
C. R. Harris, K. J. Millman, S. J. van der Walt, R. Gommers, P. Virtanen, D. Cournapeau, E. Wieser, J. Taylor, S. Berg, N. J. Smith, R. Kern, M. Picus, S. Hoyer, M. H. van Kerkwijk, M. Brett, A. Haldane, J. F. del Rı́o, M. Wiebe, P. Peterson, P. Gérard-Marchant, K. Sheppard, T. Reddy, W. Weckesser, H. Abbasi, C. Gohlke, and T. E. Oliphant, “Array programming with NumPy,” Nature, vol. 585, no. 7825, pp. 357–362, Sep. 2020. [Online]. Available: https://doi.org/10.1038/s41586-020-2649-2
J. D. Hunter, “Matplotlib: A 2D graphics environment,” Computing in Science & Engineering, vol. 9, no. 3, pp. 90–95, 2007. [Online]. Available: https://matplotlib.org/
Downloads
Published
Data Availability Statement
Data are available by contacting the authors
Issue
Section
License
Copyright (c) 2024 Journal of Science & Engineering

This work is licensed under a Creative Commons Attribution-NonCommercial-ShareAlike 4.0 International License.

