
Visualizing electric potential: mapping equipotential lines in a conductive water tray
Keywords:
electric potential, equipotential lines, electric fields, saline solution, conductive medium, voltage mapping, potential gradientAbstract
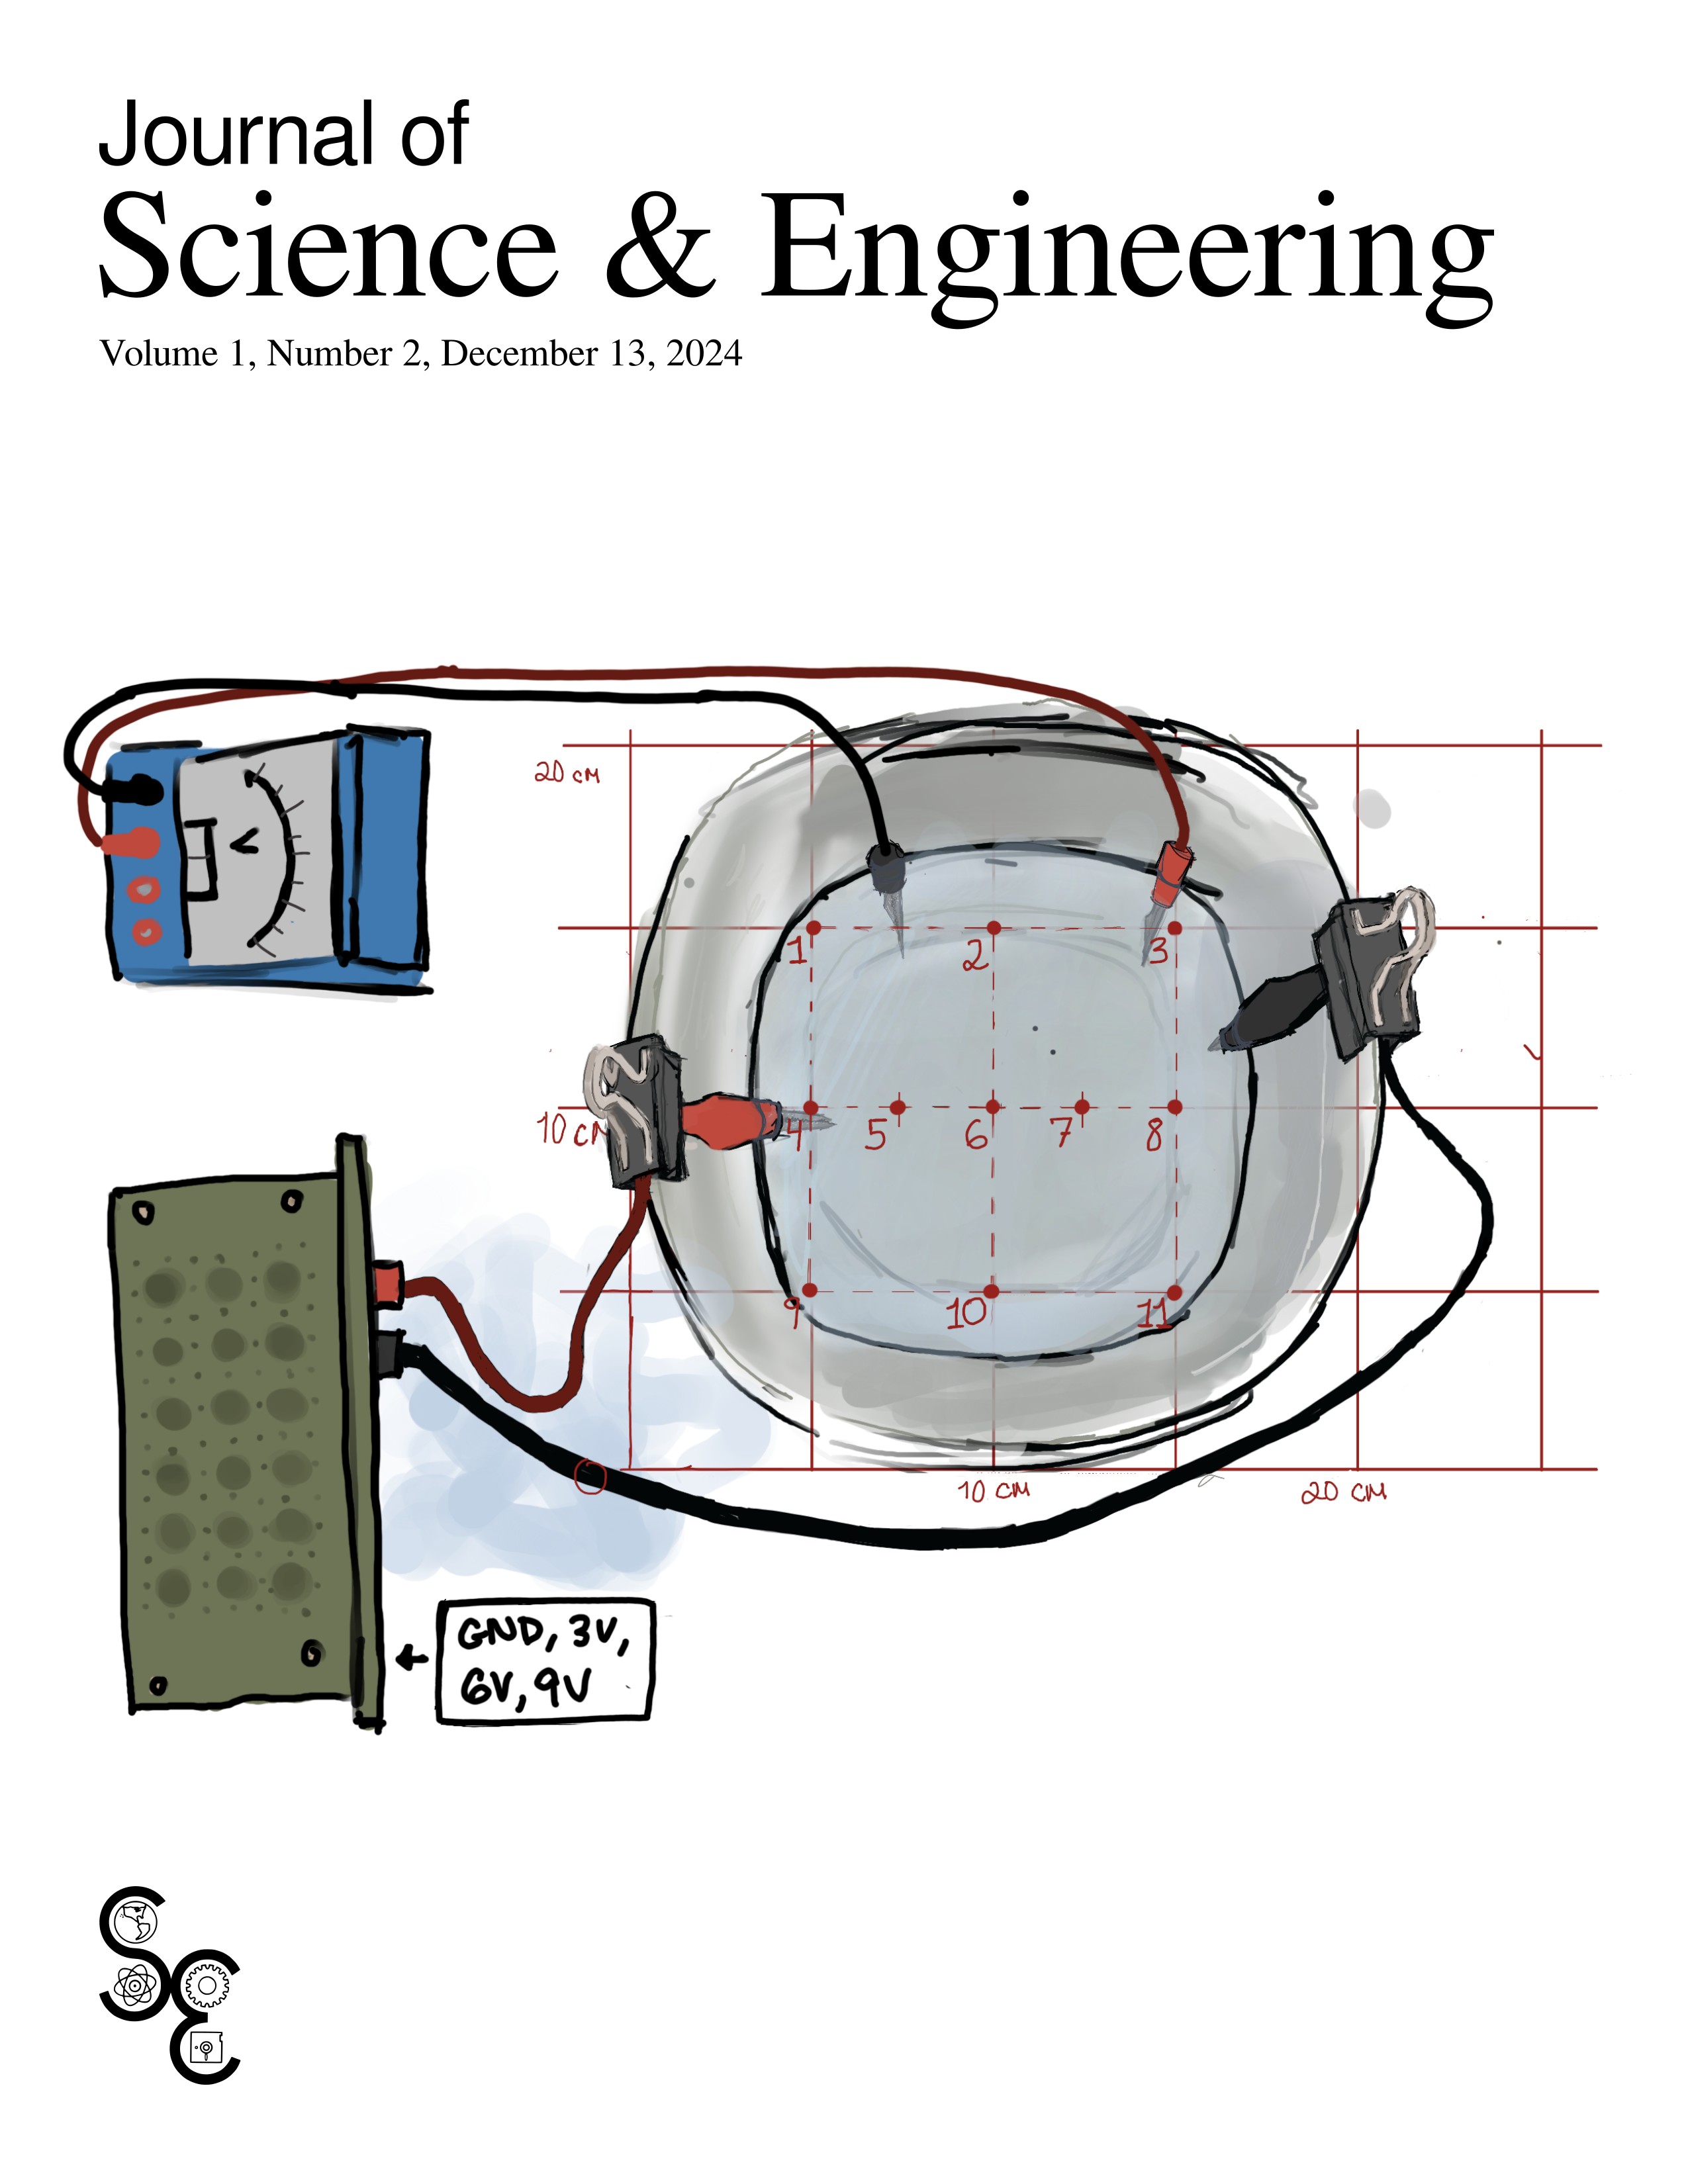
The goal of this experiment was to study the distribution of electric potential around conducting wire configurations and identify the corresponding equipotential regions. Using a water tray with a saline solution as the conductive medium, we measured the potential difference at defined points on a coordinate grid by connecting the wires to a power supply and using a multimeter to record voltages at various locations. Our observations indicated that equipotential regions were centered somewhat equidistantly between the voltage sources, with a mostly consistent rate of potential change along paths parallel to the sources. Some discrepancies between expected and observed values were noted, likely due to limitations in the measurement equipment and procedural inconsistencies. Despite these challenges, the experiment successfully demonstrated the properties of electric potential and equipotential lines, providing a clear visual representation of their relationship with the electric field.
References
P. A. Tipler and G. Mosca, Physics for Scientists and Engineers, 5th ed. New York: W H Freeman and Company, 2004.
R. A. Pelcovits and J. Farkas, Barron’s AP Physics C Premium. Fort Lauderdale, FL: Kaplan North America, 2024
S. J. Ling, W. Moebs, and J. Sanny, University Physics Volume 2. Houston, TX: OpenStax, 2016. [Online]. Available: https://openstax.org/books/university-physics-volume-2/pages/1-introduction
C. R. Harris, K. J. Millman, S. J. van der Walt, R. Gommers, P. Virtanen, D. Cournapeau, E. Wieser, J. Taylor, S. Berg, N. J. Smith, R. Kern, M. Picus, S. Hoyer, M. H. van Kerkwijk, M. Brett, A. Haldane, J. F. del Rı́o, M. Wiebe, P. Peterson, P. Gérard-Marchant, K. Sheppard, T. Reddy, W. Weckesser, H. Abbasi, C. Gohlke, and T. E. Oliphant, “Array programming with NumPy,” Nature, vol. 585, no. 7825, pp. 357–362, Sep. 2020. [Online]. Available: https://doi.org/10.1038/s41586-020-2649-2
J. D. Hunter, “Matplotlib: A 2D graphics environment,” Computing in Science & Engineering, vol. 9, no. 3, pp. 90–95, 2007. [Online]. Available: https://matplotlib.org/
Downloads
Published
Data Availability Statement
Data are available by contacting the authors
Issue
Section
License
Copyright (c) 2025 Journal of Science & Engineering

This work is licensed under a Creative Commons Attribution-NonCommercial-ShareAlike 4.0 International License.

