Computational mapping analysis of equipotential and electric field lines in gel electrophoresis rig
Keywords:
electric potential, equipotential lines, electric field visualizations, saline conductive medium, electrostatics, electric field mapping, data visualization in electrostatics, gel electrophoresis, electric field dynamicsAbstract
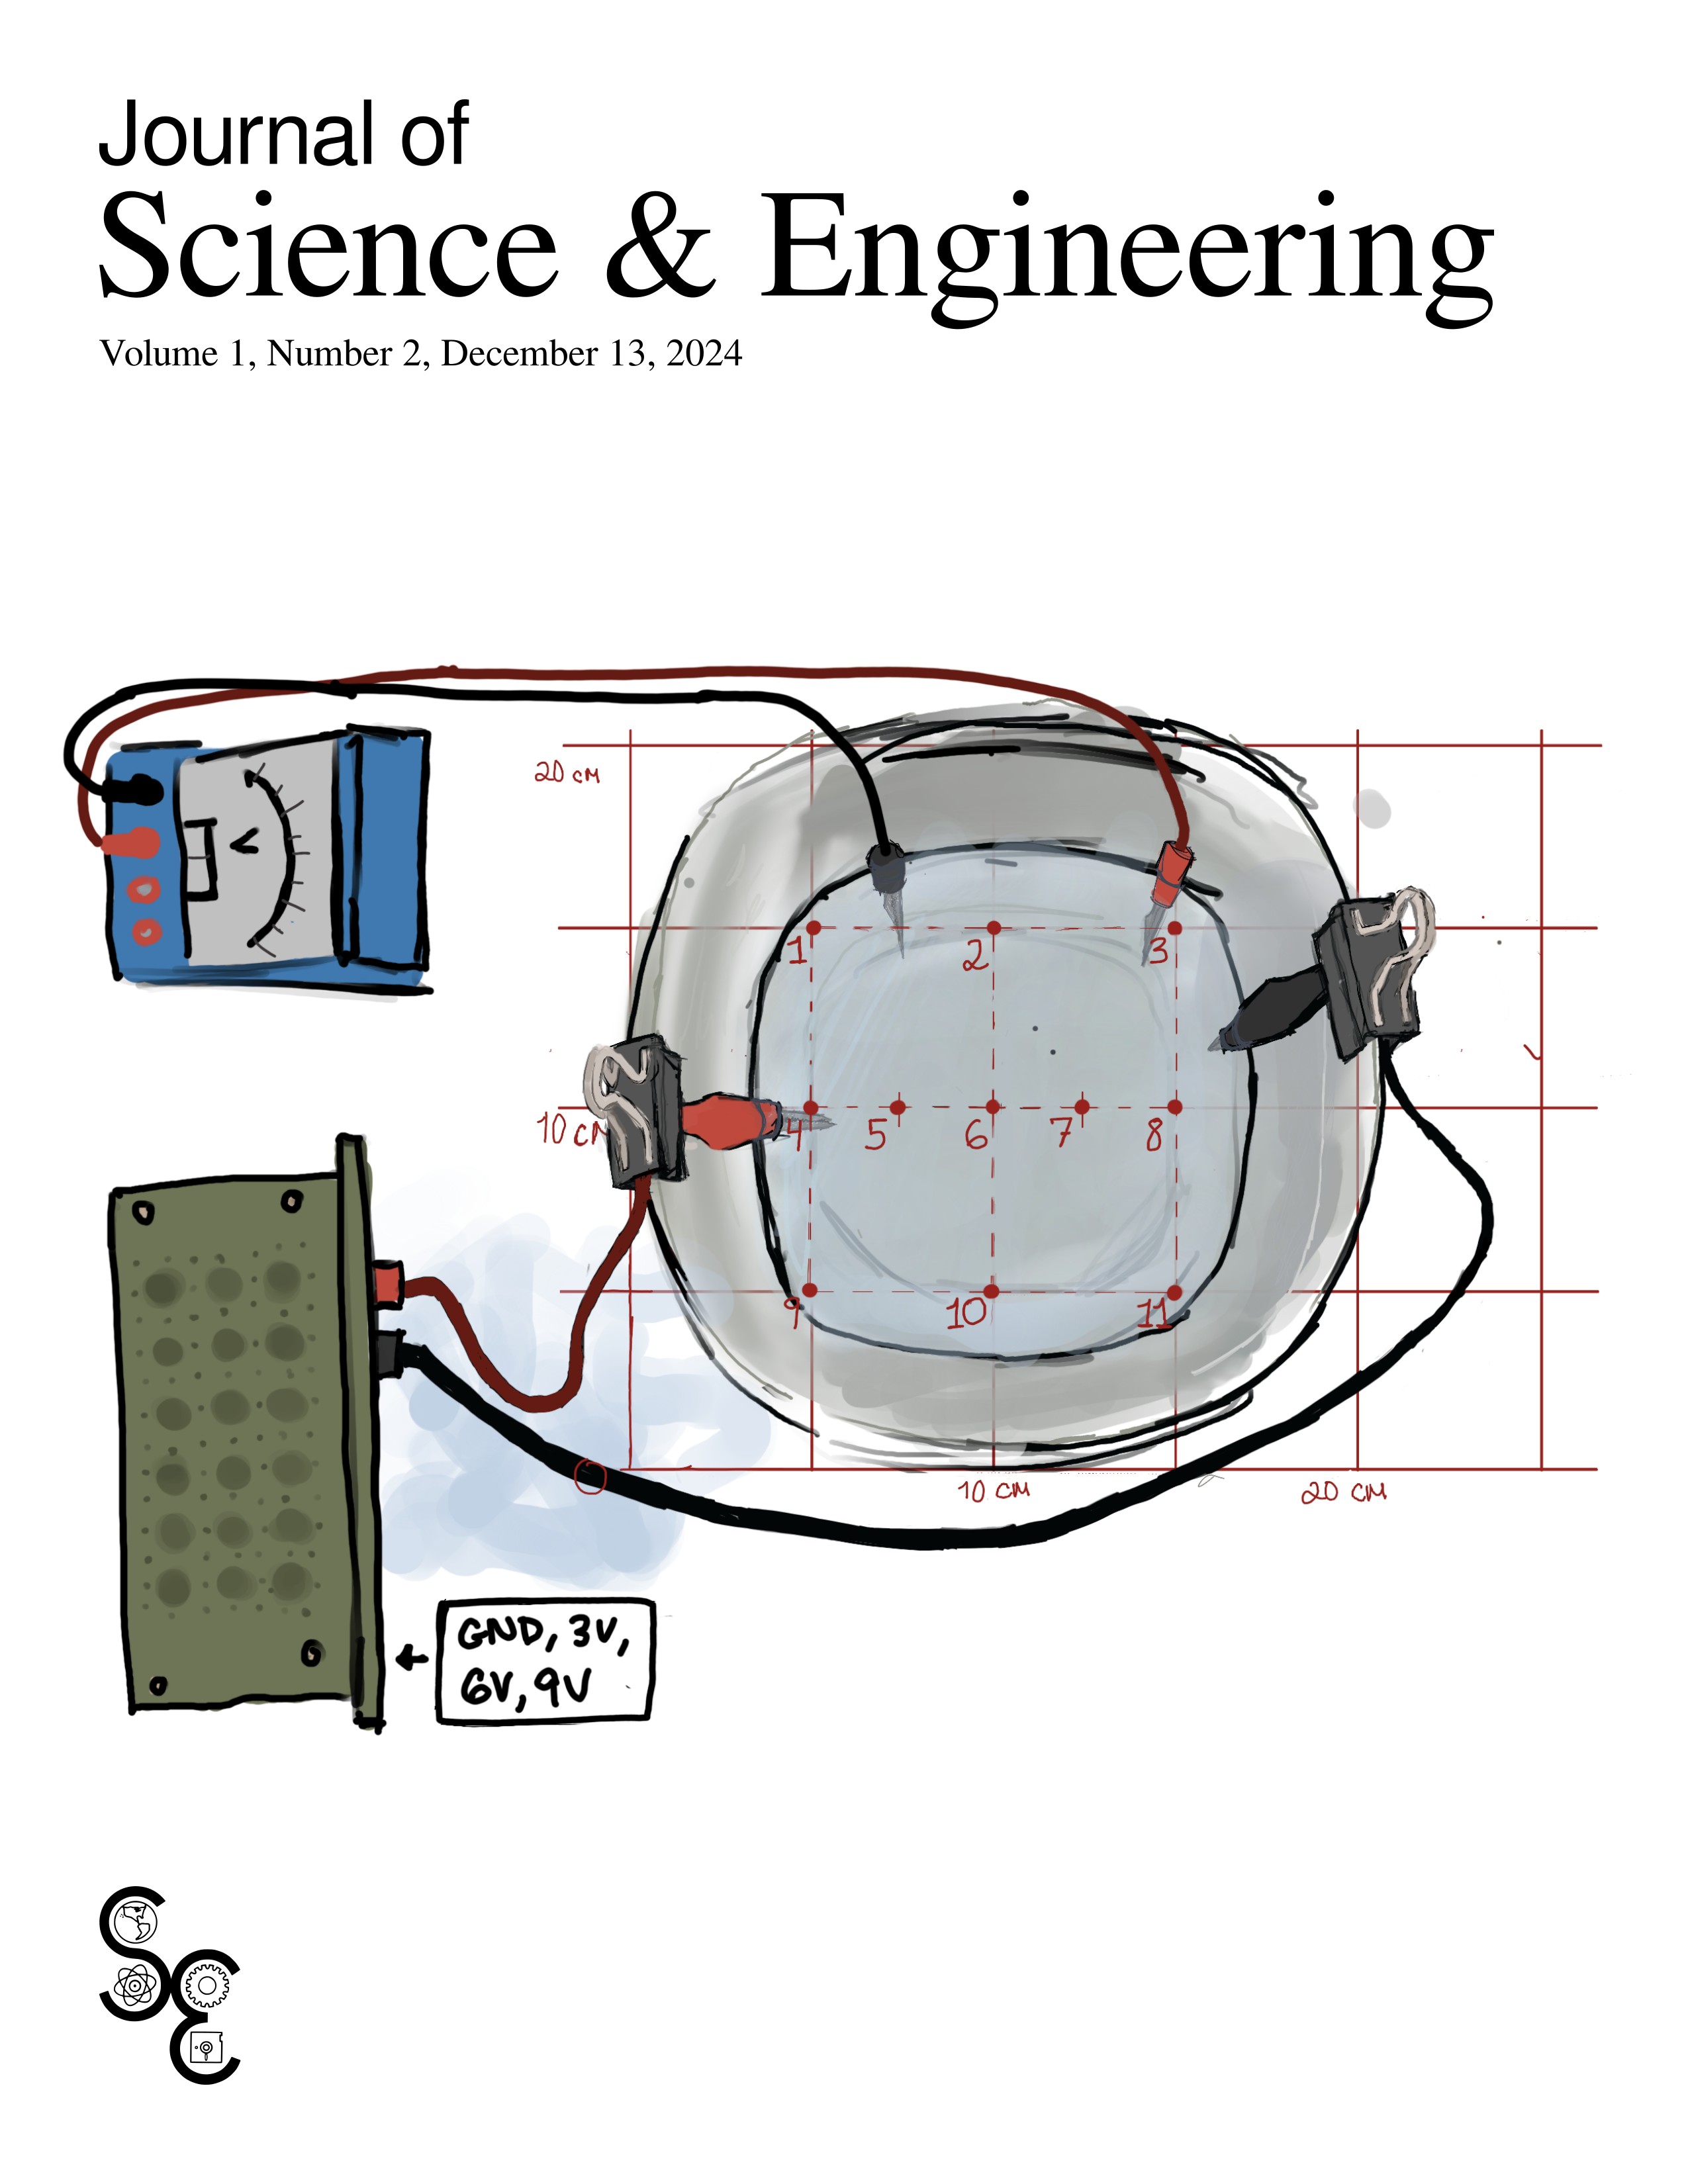
Equipotential curves, also known as isolines, are lines of constant electric potential where a charged object does no work moving along them. These lines determine the direction of an electric field (represented by a vector field) as the direction of the field at a point will be perpendicular to an equipotential line. To simulate these equipotential lines, we used two oppositely charged hex nuts to observe the relationship between potential and electric fields. After measuring the potential at every point on a 6 x 6 cm plane, we used Matplotlib to generate graphs of both equipotentials and predicted electric field lines. These experimental findings can help predict the path DNA molecules will take through a gel electrophoresis rig.
References
P. A. Tipler and G. Mosca, Physics for Scientists and Engineers, 5th ed. New York: W H Freeman and Company, 2004.
J. Stewart, D. Clegg, and S. Watson, Multivariable Calculus, 9th ed. Cengage, 2020.
L. Urry, M. L. Cain, S. A. Wasserman, P. V. Minorsky, and R. B. Orr, Campbell Biology, 12th ed. Pearson, 2021.
C. R. Harris, K. J. Millman, S. J. van der Walt, R. Gommers, P. Virtanen, D. Cournapeau, E. Wieser, J. Taylor, S. Berg, N. J. Smith, R. Kern, M. Picus, S. Hoyer, M. H. van Kerkwijk, M. Brett, A. Haldane, J. F. del Rı́o, M. Wiebe, P. Peterson, P. Gérard-Marchant, K. Sheppard, T. Reddy, W. Weckesser, H. Abbasi, C. Gohlke, and T. E. Oliphant, “Array programming with NumPy,” Nature, vol. 585, no. 7825, pp. 357–362, Sep. 2020. [Online]. Available: https://doi.org/10.1038/s41586-020-2649-2
J. D. Hunter, “Matplotlib: A 2D graphics environment,” Computing in Science & Engineering, vol. 9, no. 3, pp. 90–95, 2007. [Online]. Available: https://matplotlib.org/
Downloads
Published
Data Availability Statement
Data are available by contacting the authors
Issue
Section
License
Copyright (c) 2024 Journal of Science & Engineering

This work is licensed under a Creative Commons Attribution-NonCommercial-ShareAlike 4.0 International License.

